Sand and Gravel Deposits
Aggregate resources, including sand and gravel, are critical materials used in construction and roadway maintenance, as well as for coastal resilience projects such as beach nourishment. Sand and gravel production in the Commonwealth of Virginia was valued at $156 million in 2024, comprising 15% of the total mined non-fuel minerals. Aggregate materials are used to build structures, maintain roads, control erosion, elevate low-lying areas, and restore habitats (see our Mineral Resources web page for more information). Aggregate is a high-volume and low-value commodity, so transportation costs increase significantly when the material is sourced far from where it is needed. By identifying local sources, potential projects can save money and plan more efficiently and equitably for the long-term.
Why the Coastal Plain?
Aggregate-specific mapping has not widely been conducted in the Virginia Coastal Plain; therefore, our geologists examined other aggregate resource mapping projects to identify standard mapping practices for these resources. Some existing aggregate resource inventories or map products include Michigan, Minnesota (MN) and Washington (WA) in the United States, and the Manitoba Province in Canada. Available maps typically depict surficial landforms, many of which are a result of glacial activity in the Pleistocene (MNDNR, 2024a, 2024b; WADNR, 2024; MGS, 2025). Virginia is located south of the previous maximum glacial extent; therefore, surficial deposits are generally mapped as fluvial, colluvial and eolian in origin. Other sediments associated with the evolution of the Chesapeake Bay and former offshore marine environments also host sand and gravel. Southworth and others (1998) produced an aggregate resource potential map for specific geologic units along the I-95 corridor for the Mid-Atlantic at the 1:250,000-scale. This product displayed major geologic unit groups and typical resources (Southworth and others, 1998).
There is an established sand and gravel industry in Virginia’s Coastal Plain, along with other non-fuel mineral resources such as clay, marl, titanium, and zirconium. With the growing need for locally sourced aggregate and fill materials, Virginia Energy proposed a 3-year aggregate resource characterization focal area study to the Virginia Coastal Zone Management (CZM) Program in 2023. This opportunity has been supported by funding from the National Oceanic and Atmospheric Administration, with the Virginia CZM Program serving as the lead agency for administering funds (List of Grants). Mineral resources are an important consideration for local comprehensive planning and recognized in the Code of Virginia §15.2-2224. It is mutually beneficial to municipalities, aggregate producers, prospective developers, and conservation professionals to have these data available for effective long-term planning. This project provides an opportunity to apply well-established geologic mapping and compilation methods in the Coastal Plain to localities that are threatened by significant loss of land and infrastructure due to increased flooding hazards.
CURRENT WORK (Fiscal Year 2025):
Eastern Shore:
Virginia Energy geologists began the assessment for the third and final study area, the Accomack-Northampton Planning District, which includes the two counties and towns on Virginia’s Eastern Shore. We anticipate completion of this phase in late 2026.
Dredged Material Characterization
Virginia Energy is helping to support beneficial use (BU) strategies for dredged material from shallow tidal creeks and nearshore environments in coastal Virginia. We are accomplishing this through collaborative work with the Virginia CZM Program and rural coastal Virginia Planning District Commissions. This work is ongoing and includes geochemical and mineral characterization on channel fill sediments to inform reuse limitations, economic mineral potential, and mine site reclamation potential (Figure 1). The Virginia Institute of Marine Science (VIMS) Shoreline Studies Program donated archived vibracores for this project scope, and we are grateful for their assistance and insight. VIMS staff published data on channel morphology, bathymetry, sediment composition, and chemical and physical characteristics for high priority tidal creeks in the Middle Peninsula for disposal and beneficial use considerations. More information on the VIMS assessments can be accessed here (Shallow Draft Dredging Reports). This work will help bridge together data for onshore and offshore resource potential, solicit feedback from industry stakeholders on BU opportunities for mineral supply chain and processing opportunities, and provide applicable screening and testing procedures that can be expanded to future dredged material management activities.
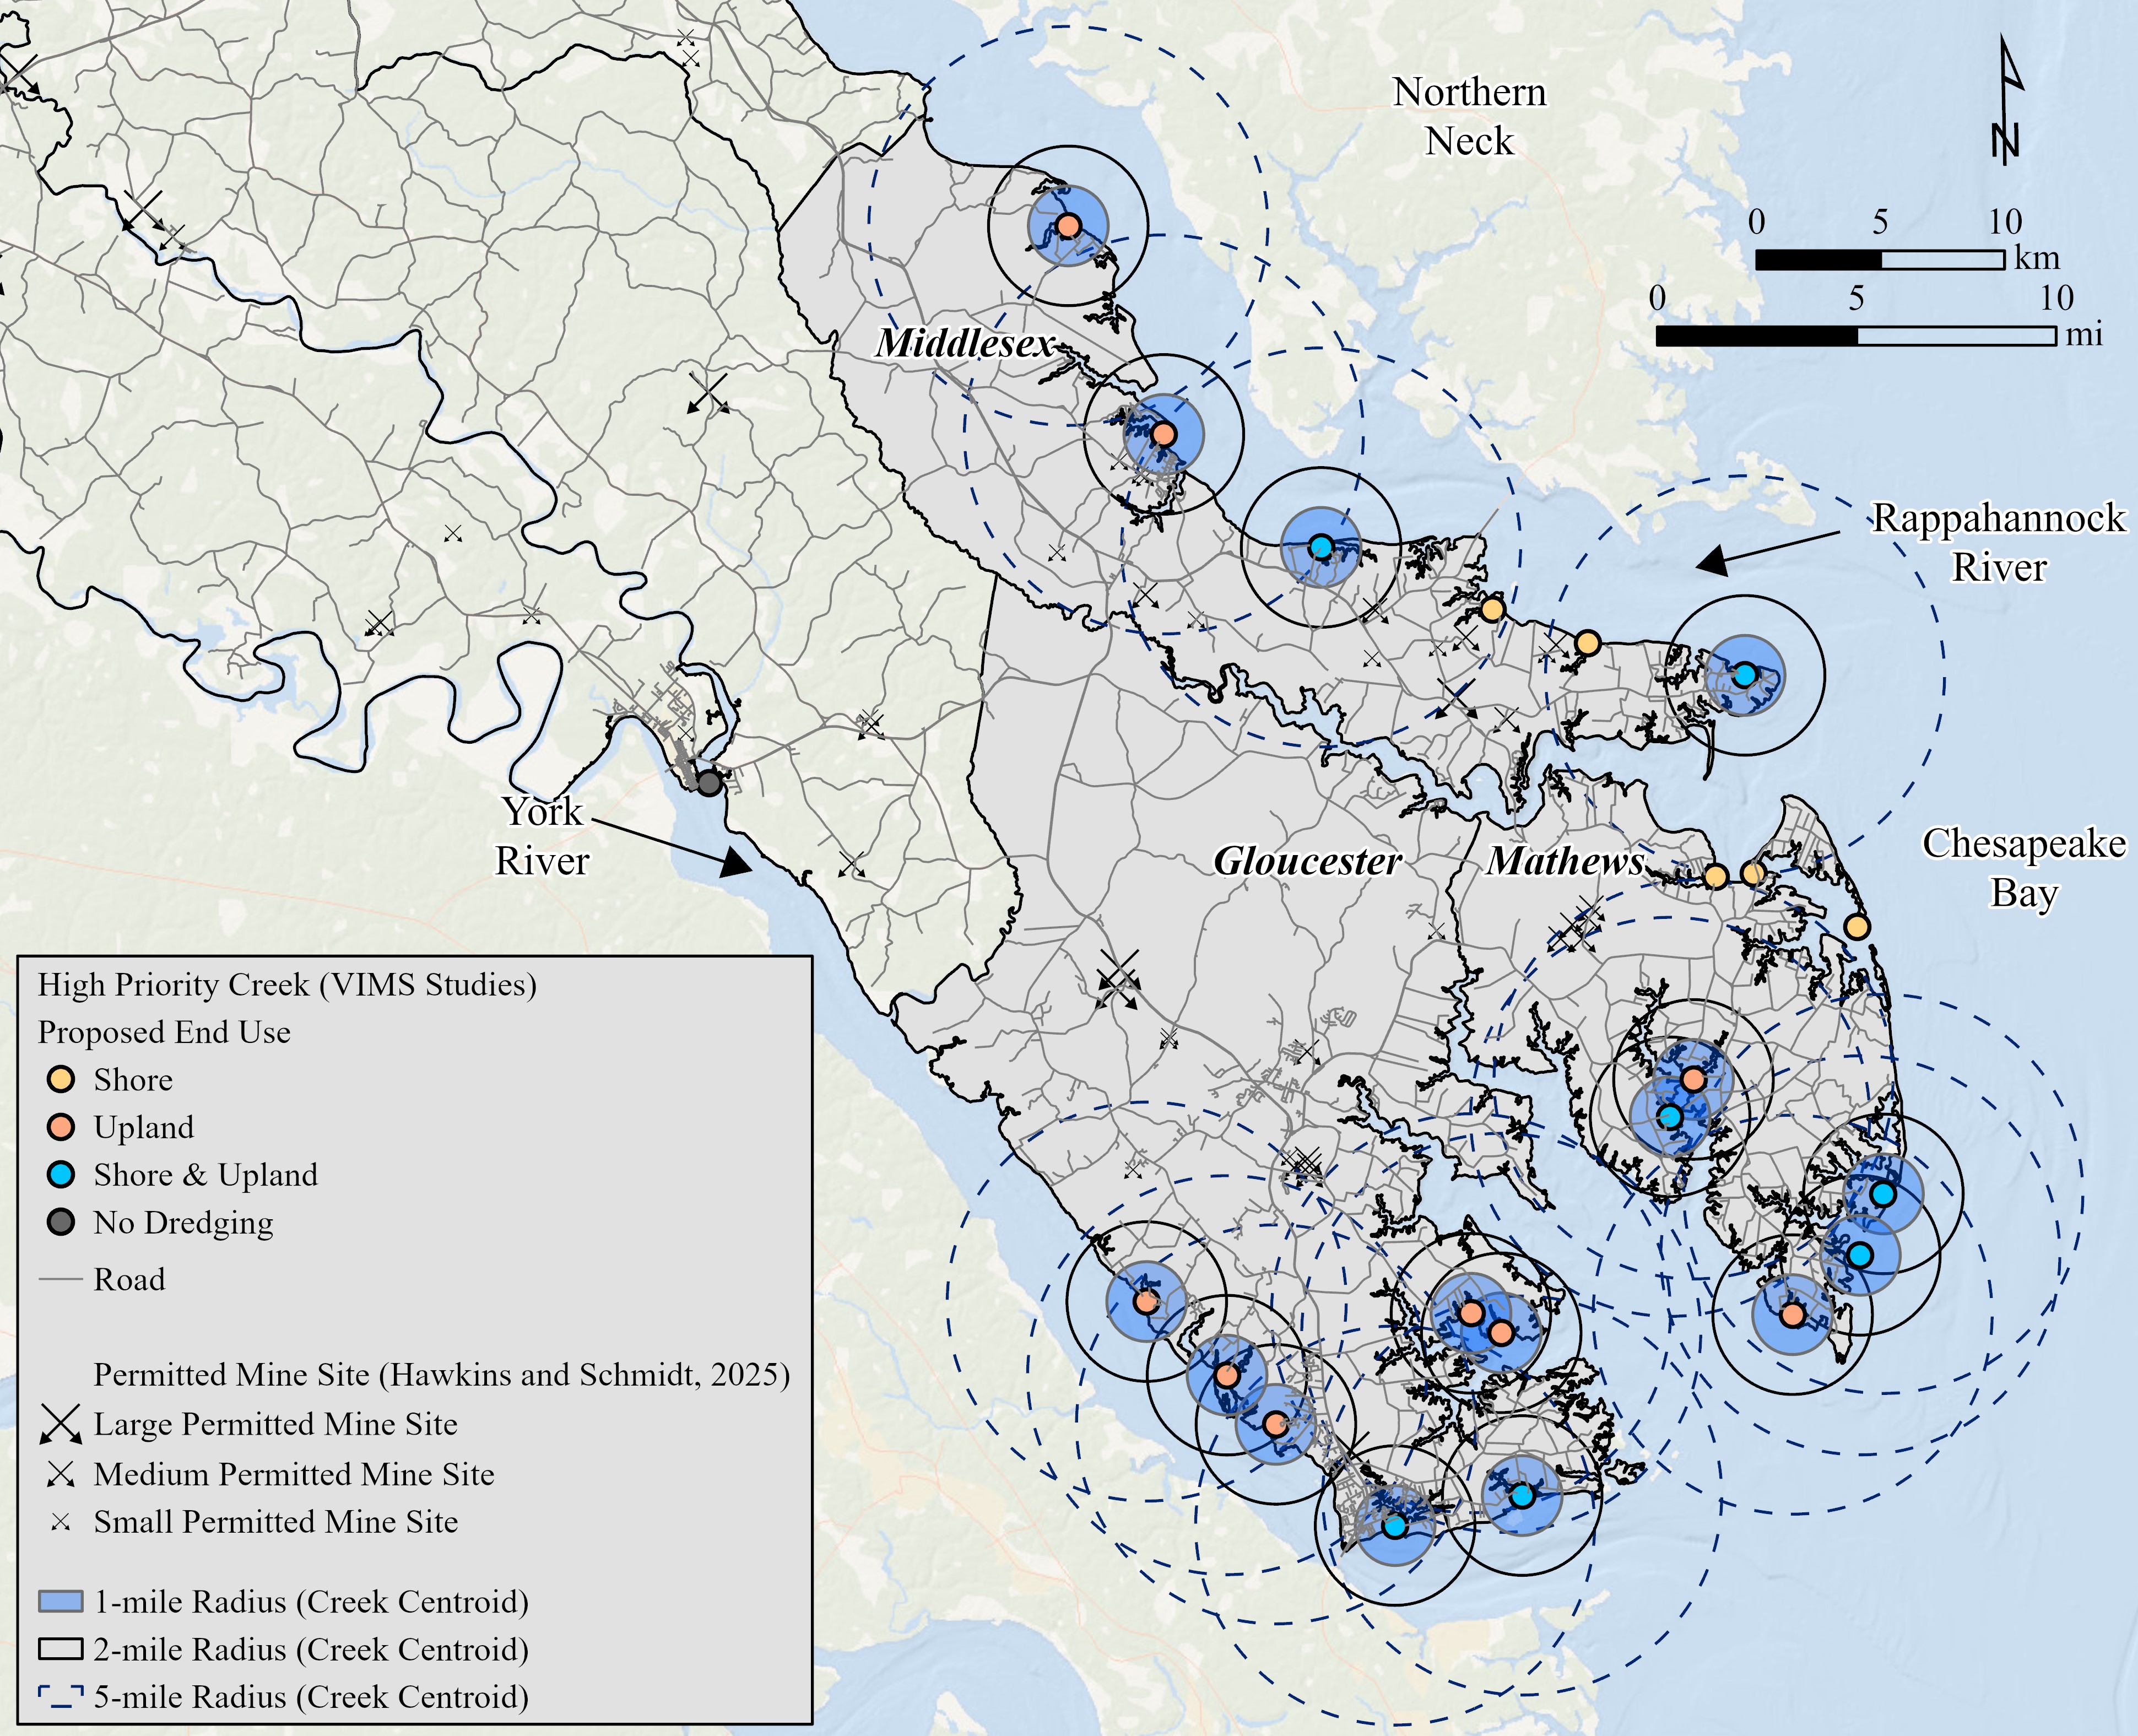
Figure 1: Locations of active permitted mine sites (from Hawkins and Schmidt, 2025) and priority creeks for upland disposal needs. These creeks are buffered by a 1-, 2-, and 5-mile radius to show proximity to potential onshore mine sites.
Completed Work
Middle Peninsula (Fiscal Year 2023):
The Middle Peninsula Planning District was the pilot phase for the sand, gravel, and clay resource potential assessment. The Middle Peninsula encompasses almost 900 thousand acres, with over 1,000 miles of shoreline. Virginia Energy staff conducted a multiparameter analysis for resource potential using EsriTM ArcGIS software by synthesizing various geologic datasets including geologic borehole logs, mine site commodity data, 1-meter lidar, sediment textural data, soil survey data, and the national wetland inventory data. Staff characterized overburden and mineable deposit materials from active sites across the Middle Peninsula and incorporated new grain size and geochemical data into the analysis. The analysis was completed by converting geologic and soil data to overlay raster datasets and then using the cell statistics geoprocessing tool to create a cumulative sum raster. The final output raster was classified into three classes representing higher, lower, and unlikely potential for sand and gravel deposits. These classes represent grid cell values that are either greater than 75% (higher), between 25% and 75% (lower), or less than 25% (unlikely) of the maximum value of the output raster.
The majority of potential sand and gravel deposits identified in the Middle Peninsula are within Pleistocene fluvial-estuarine terraces, extending into older Pliocene units. Clay resources are typically limited to Miocene Chesapeake Group marine units. These data can support resilience initiatives that were identified in the 2021 Virginia Coastal Resilience Master Plan, which include efforts to mitigate widespread habitat loss, impacts to critical infrastructure, and potential residential displacement due to increased coastal flooding. Planners and contractors who are interested in materials for elevating roads, shoring up existing structures, providing shoreline protection, and restoring wetland habitats can utilize the data to understand where potential resources may occur.
Deliverables for FY23 are available in a zip folder for download and include a technical summary report, 1:100,000-scale map showing sand and gravel potential (Figure 2), and Geologic Map Schema (GeMS) Level-3 compliant geodatabase with resources and associated metadata. Users should consult the report for details on methodology and criteria used for the resource potential analysis. Additional information is available within the report appendices including a field log of site visits, lithologic and geochemical data for samples, and a summary of project coordination activities throughout the grant. The final product deliverables can be downloaded from our Maps and Publications store here »
Figure 2: 1:100,000-scale sand and gravel potential map for the Middle Peninsula, included as Plate 1 in the technical summary report, finalized February 2025.
Northern Neck (Fiscal Year 2024):
The study area for the second phase of work was the Northern Neck Planning District. The Northern Neck Planning District encompasses almost 480,000 acres, with approximately 1,370 miles of shoreline along the Chesapeake Bay, Rappahannock River, and Potomac River. The project followed a similar methodology that was applied across the Middle Peninsula region (Hawkins and Schmidt, 2025). Figure 3 displays the GIS geoprocessing schema applied for the Northern Neck Planning District. Differing from the approach used in the Middle Peninsula, four quantiles were applied to this product to provide more context into the interquartile range of 25-75%. The classes are categorized where grid cell values are either greater than 75% (higher), between 50% and 75% (moderate), between 25% and 50% (lower), or less than 25% (unlikely) of the maximum value of the output raster.
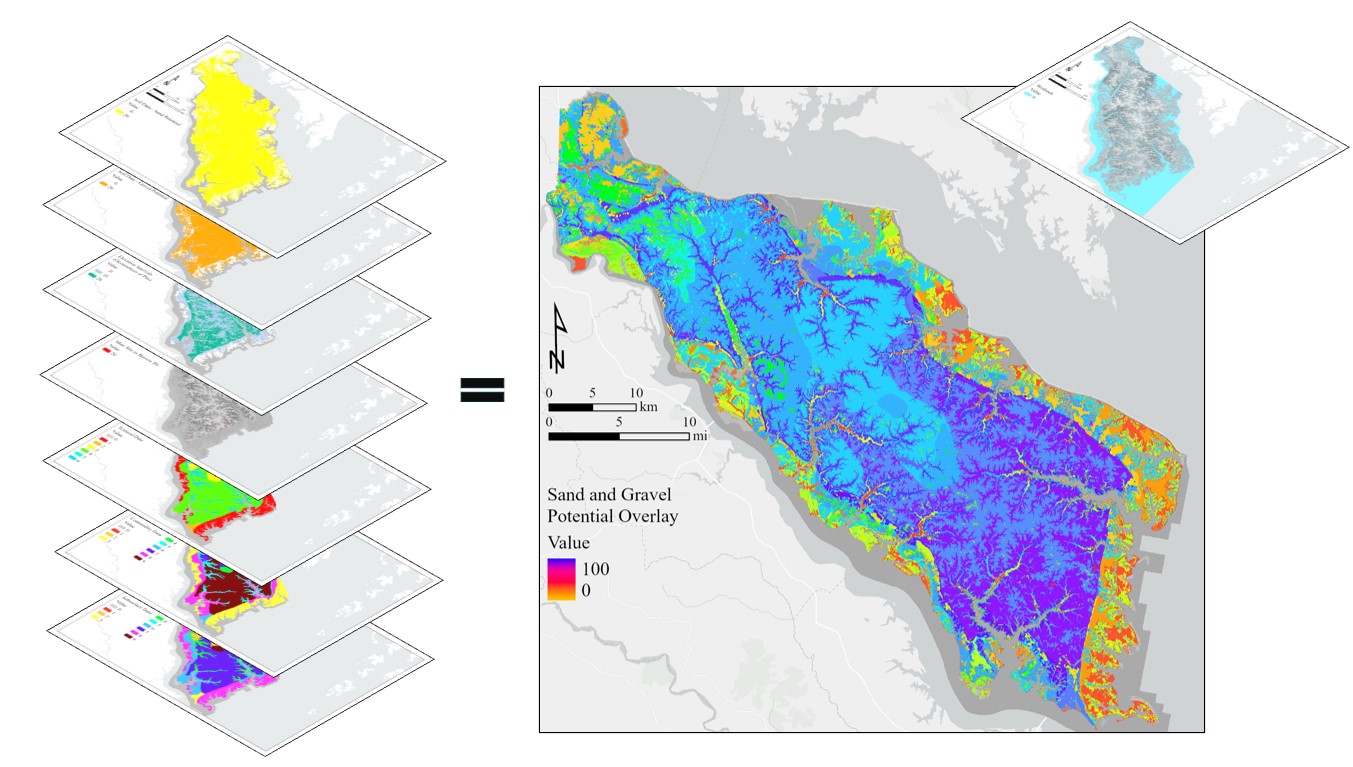
Figure 3: Seven input rasters (left) used in the cell statistics sum tool to create a final output raster with unique grid cell values (right). A wetland mask raster was applied (upper right corner) prior to reclassing the output raster into four quantiles.
Based on the assessment, the Pleistocene Windsor (Qw) and Tabb Formations were ranked higher than other geologic units for sand and gravel potential. The Pleistocene Bacons Castle (Qbc) and Shirley Formations, and Pliocene sections of the Chesapeake Group demonstrated potential for mineable deposits.
While the Middle Peninsula and Northern Neck Planning District were evaluated independently, both areas have similar geology and geomorphic features (e.g., scarps and terraces). However, the Middle Peninsula has a larger extent of the Qbc unit and more modern rivers that traverse the peninsula, which may be associated with more fluvial-derived sediments, and therefore coarser sands and gravels. Noticeably, the Qw unit ranked consistently high during the initial raster analysis for both regions for higher potential for sand and gravel. Active sites producing sand for concrete and asphalt across the Middle Peninsula and Northern Neck are generally limited to larger sites that are able to screen and sort different size fractions. Northern Neck operators indicated that their primary end-uses for their material are for fill, road base, construction, and beach nourishment. Other factors such as established markets and proximity to urban areas are likely to have influenced where sites exist, subsequent to favorable geology. The assessments across both the Middle Peninsula and Northern Neck did not consider the varied economics on a site-by-site basis. Rather, the assessments followed a standardized approach to provide reconnaissance data to inform resource potential based on demonstrated criteria.
Deliverables for FY24 are available in a zip folder for download and include a technical summary report, 1:100,000-scale map showing sand and gravel potential (Figure 4), and Geologic Map Schema (GeMS) Level-3 compliant geodatabase with resources and associated metadata. As with the Middle Peninsula products, users should consult the report for details on methodology and criteria used for the resource potential analysis. Additional information is available within the report appendices including a field log of site visits, lithologic and geochemical data for samples, and a summary of project coordination activities throughout the grant. The final product deliverables can be downloaded from our Maps and Publications store here ».
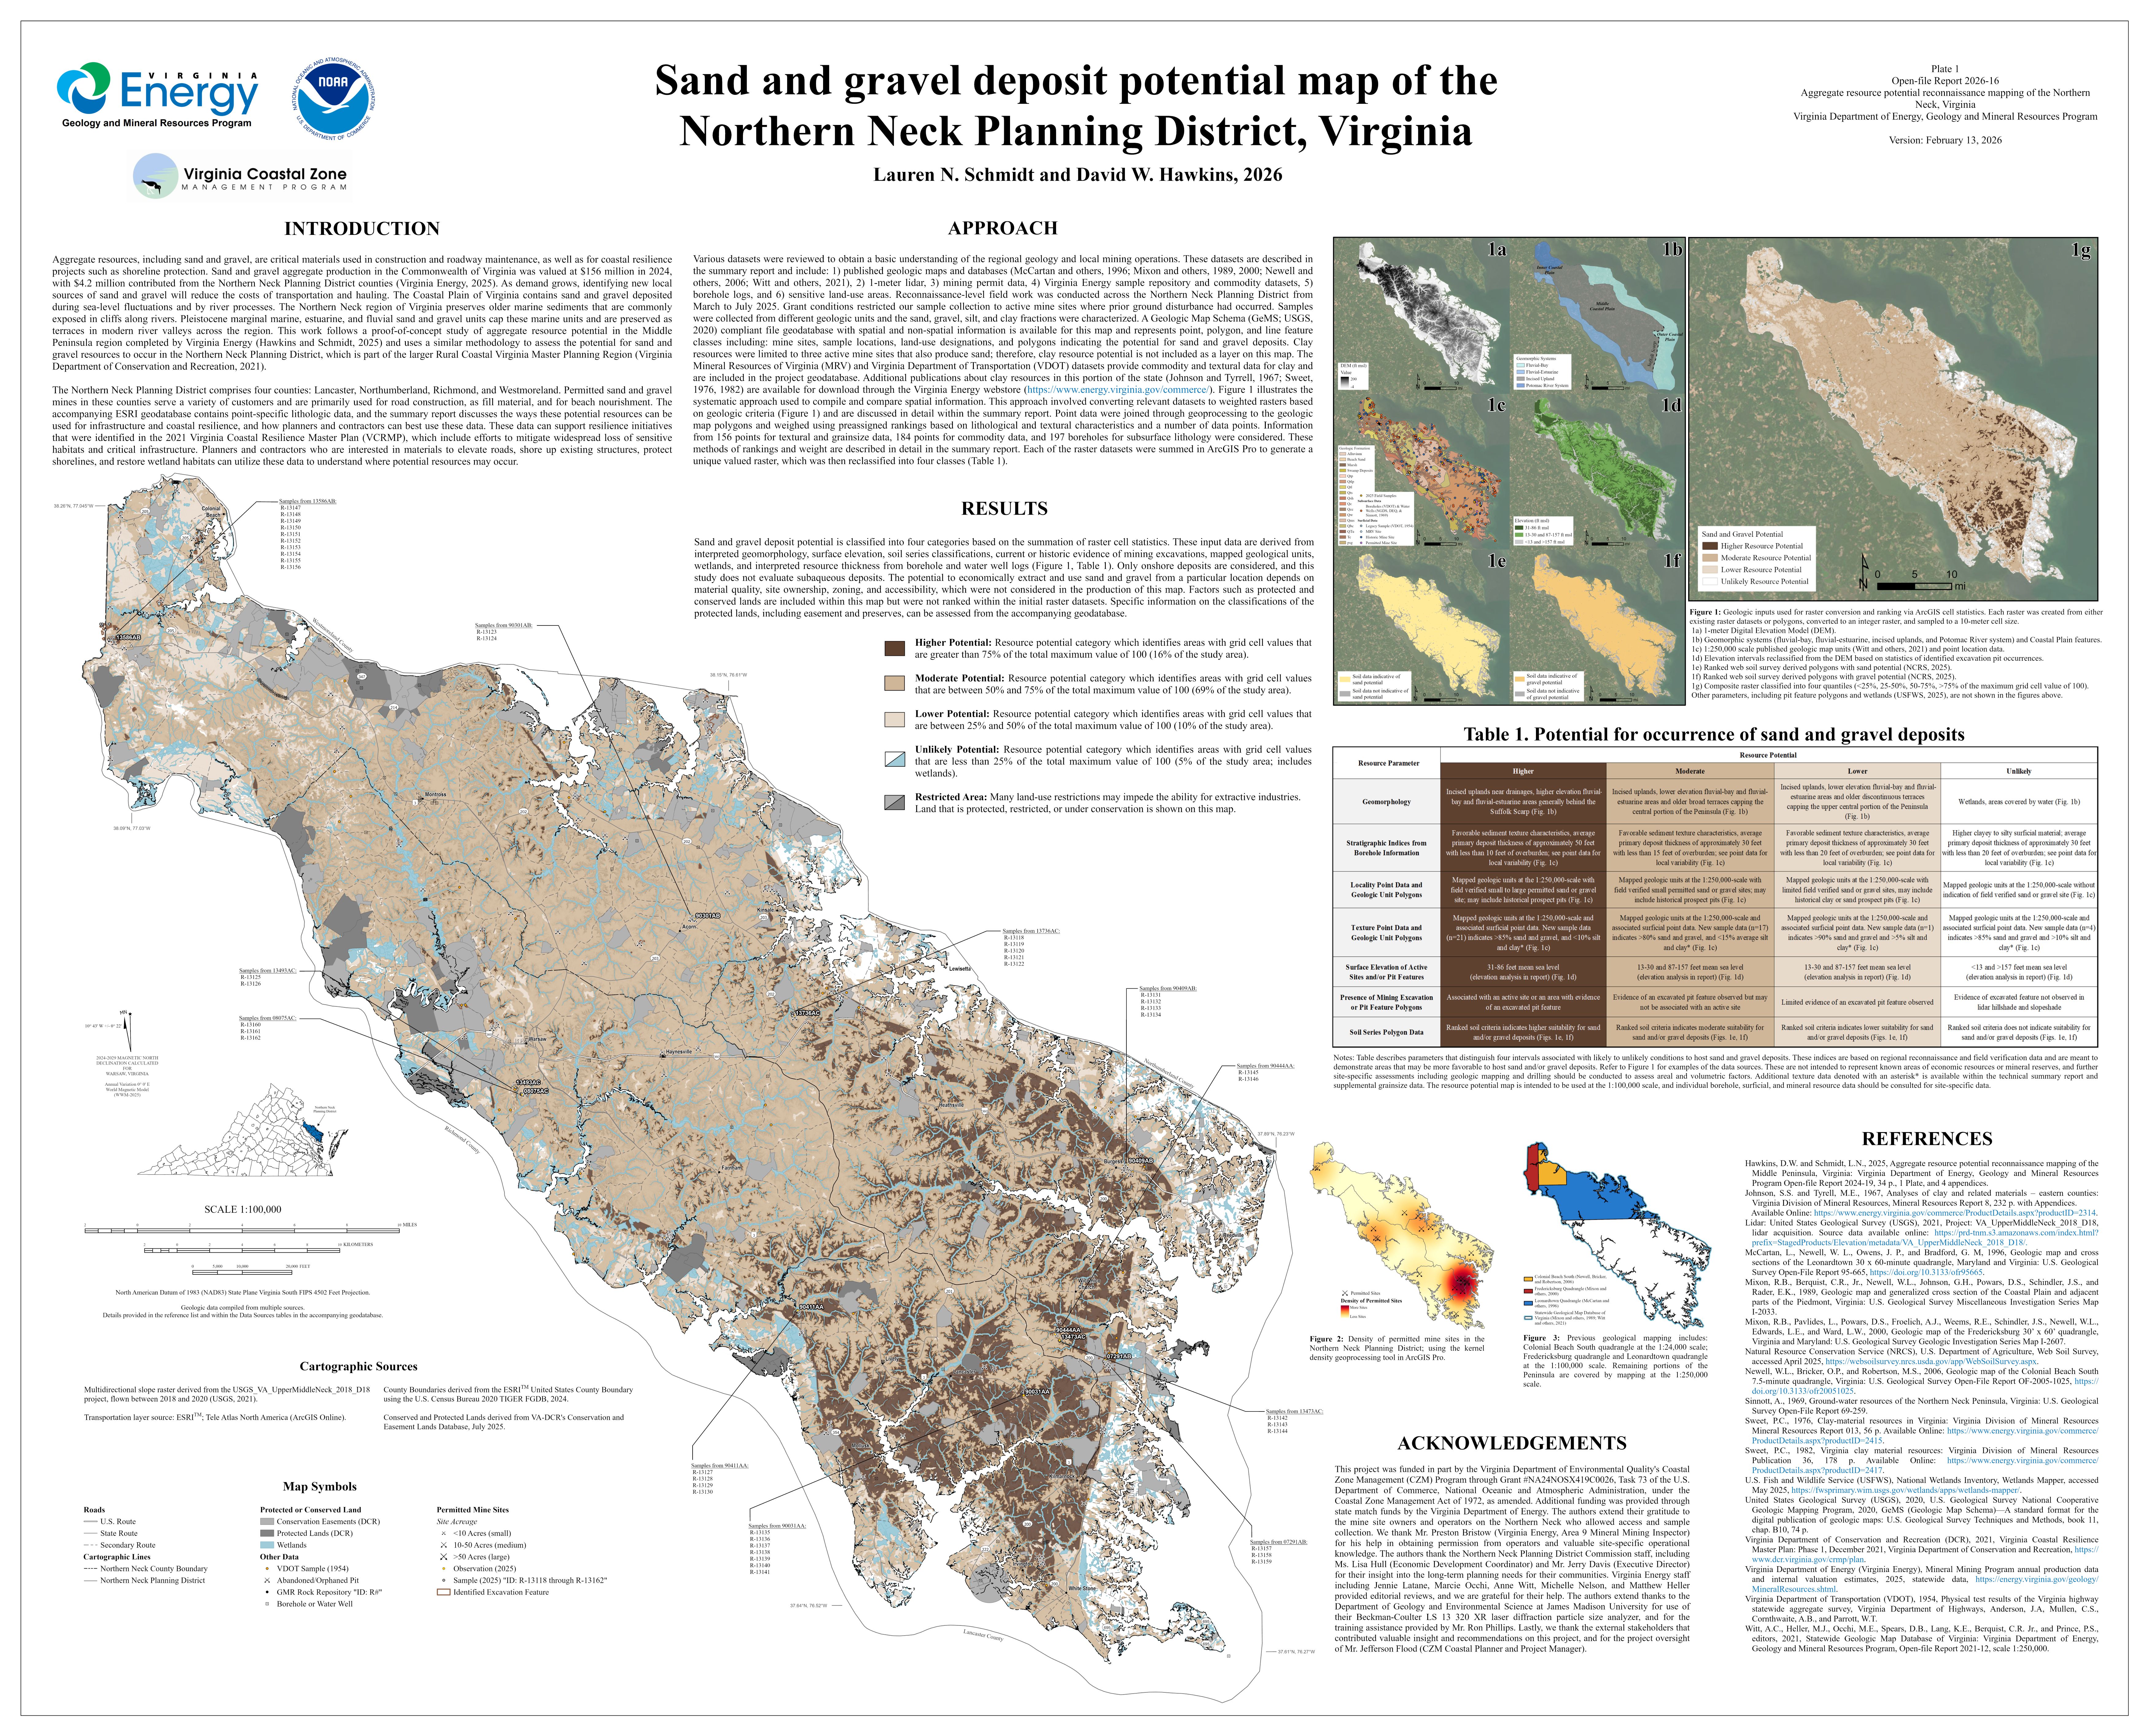
Figure 4. 1:100,000-scale sand and gravel potential map for the Northern Neck Planning District, included as Plate 1 in the technical summary report (OFR 2026-16), finalized February 2026.
Other Links:
Virginia Coastal Zone Management Program
Virginia CZM Program Focal Areas
Virginia CZM Program FY 2023 Grant Project List
Virginia CZM Program FY 2024 Grant Project List
Virginia CZM Program FY 2025 Grant Project List
Selected References:
DCR, 2021, Virginia Department of Conservation and Recreation, Virginia Coastal Resilience Master Plan, Phase One, December 2021, https://www.dcr.virginia.gov/crmp/plan.
Hawkins, D.W. and Schmidt, L.N., 2025, Aggregate resource potential reconnaissance mapping of the Middle Peninsula, Virginia: Virginia Department of Energy, Geology and Mineral Resources Program Open-file Report 2024-19, 34 p., 1 Plate, and 4 appendices.
Hawkins, D.W. and Schmidt, L.N., 2026, Aggregate resource potential reconnaissance mapping of the Northern Neck, Virginia: Virginia Department of Energy, Geology and Mineral Resources Program Open-file Report 2026-16, 33 p., 1 Plate, and 4 appendices.
Manitoba Geological Survey (MGS), 2025, Aggregate Resources Publication Index website, https://www.gov.mb.ca/iem/geo/surficial/aggregate.html.
Minnesota Department of Natural Resources (MNDNR), 2024a, Aggregate Resources Mapping Program website, https://www.dnr.state.mn.us/lands_minerals/aggregate_maps/index.html.
Minnesota Department of Natural Resources (MNDNR), 2024b, Aggregate Resources Mapping Program Geologic Process factsheet, https://files.dnr.state.mn.us/lands_minerals/geologic_processes.pdf.
Southworth, C.S., Newell, W.L., Armstrong, T.R., and Hyde, P., 1998, Geologic map of aggregate resource units for the Baltimore-Washington urban corridor in the Mid-Atlantic region: United States Geological Survey, Open-file Report 98-349, Plate 1, https://doi.org/10.3133/ofr98349.
Washington State Department of Natural Resources (WADNR), 2024, Aggregate Resources website, https://www.dnr.wa.gov/aggregate-resources.
Witt, A.C., Heller, M.J., Occhi, M.E., Spears, D.B., Lang, K.E., Berquist, C.R. Jr., and Prince, P.S., editors, 2021, Statewide Geologic Map Database of Virginia: Virginia Department of Energy, Geology and Mineral Resources Program, Open-file report 2021-12, scale 1:250,000.