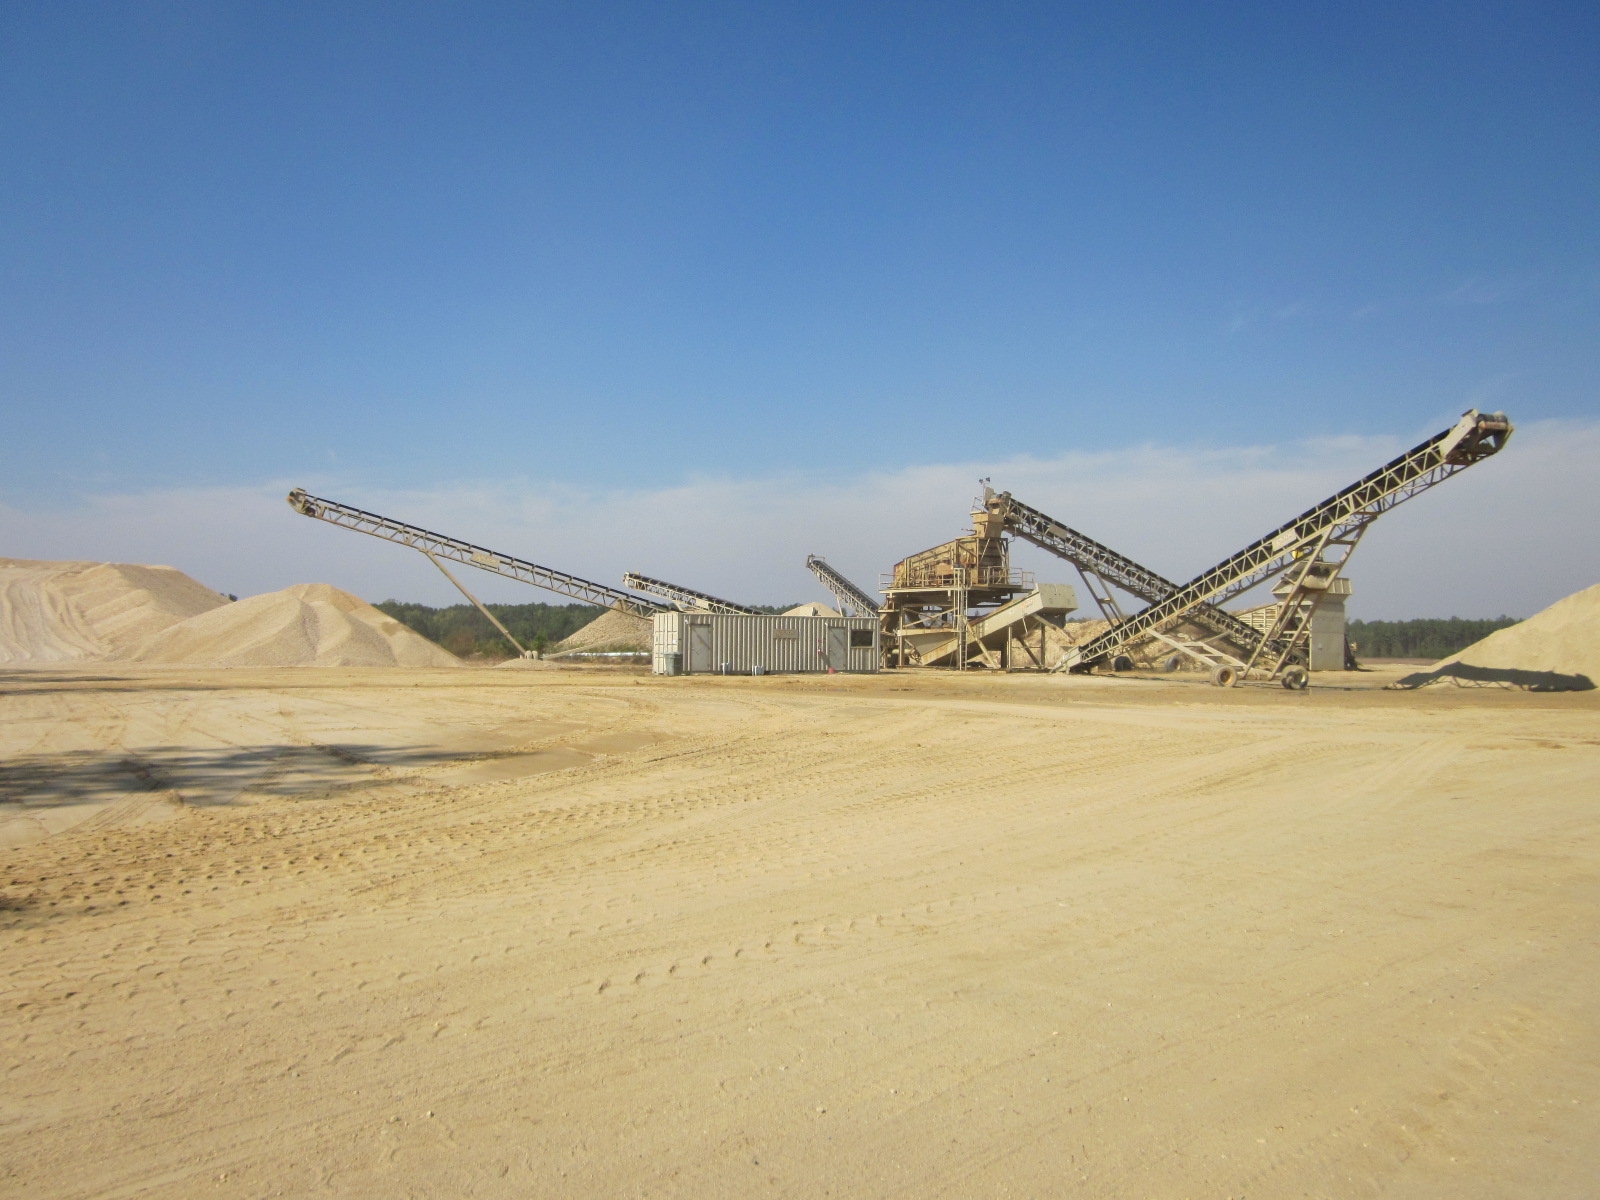
Bardon, Inc. Hickory Hill, Gloucester County
Sand and gravel natural aggregate resources in Virginia are relatively plentiful and have long been utilized in the highway and building construction industries. Natural aggregate is a main component of concrete and asphalt, adding strength to building foundations and durability to roof shingles. Transportation infrastructure consumes enormous quantities of construction aggregate for bridges, roads, airport runways, sidewalks, and pathways. The National Stone, Sand & Gravel Association has estimated that about 38,000 tons of aggregates are required to build one lane-mile of interstate highway. Sand and gravel are favored landscaping materials and also used in recreational applications such as golf courses, volleyball courts, and lake-side beaches. Aggregates serve essential roles in erosion control, water filtration and coastal shoreline protection.
Number of mines producing sand and gravel in Virginia: 223
Number of counties in Virginia with mines: 49
Number of operators: 177
Quantity produced in 2025: 9.4 million short tons
Most recent ranking (USGS) in the U.S.:40th highest producing state in 2025
Estimated market value in 2025: $160.4 million
Most of the sand and gravel produced in Virginia is extracted from surface pits located in the Coastal Plain province. Natural aggregate is mined mainly from sand and gravel deposited as riverine and coastal terraces during the Quaternary and Tertiary geologic periods. Cretaceous sand and gravel deposits in the Potomac Group are also mined. In the Blue Ridge and eastern Piedmont provinces, sand is extracted at several sites from modern river terrace deposits. Sand and gravel is dredged from rivers in Augusta, Frederick, Page, Rockingham and other counties in the Valley and Ridge province. Sand is also produced from residuum over the Devonian Ridgeley Sandstone in Craig County. In the Appalachian Plateaus region, sand and gravel has been dredged in the past from the Levisa and Clinch Rivers.
The economic downturn in the United States known as the Great Recession (late-2007 to 2009) had a significant impact on the production of construction aggregate in Virginia. In the five years preceding the recession (2002-2006), the total amount of sand and gravel produced by mines in Virginia averaged about 14.9 million short tons (13.5 million metric tons) per year. The rapid decline in annual production reported after 2006 may reflect early signals of decreasing market demand and the onset of the economic recession that officially lasted through 2009. In the years following the recession, annual production has been significantly lower, averaging about 8.6 million short tons (7.8 million metric tons), as much as 42 percent below the average pre-recession level. The unit sales price of sand and gravel aggregate sold in Virginia has increased somewhat since the Great Recession and is currently about $17.1 per short ton. Increasing competition from crushed stone operations that are marketing byproduct or manufactured products that can be substituted for sand and gravel have also had an impact on the demand for traditional sand and gravel products.
The costs of transporting construction aggregates from the mine source to the end user are a major factor controlling the marketable geographic range, which is typically within a 25 to 30 mile radius of the mine site. It is imperative that high quality construction-grade resources are carefully managed and conserved for the future as part of informed land use decision-making.
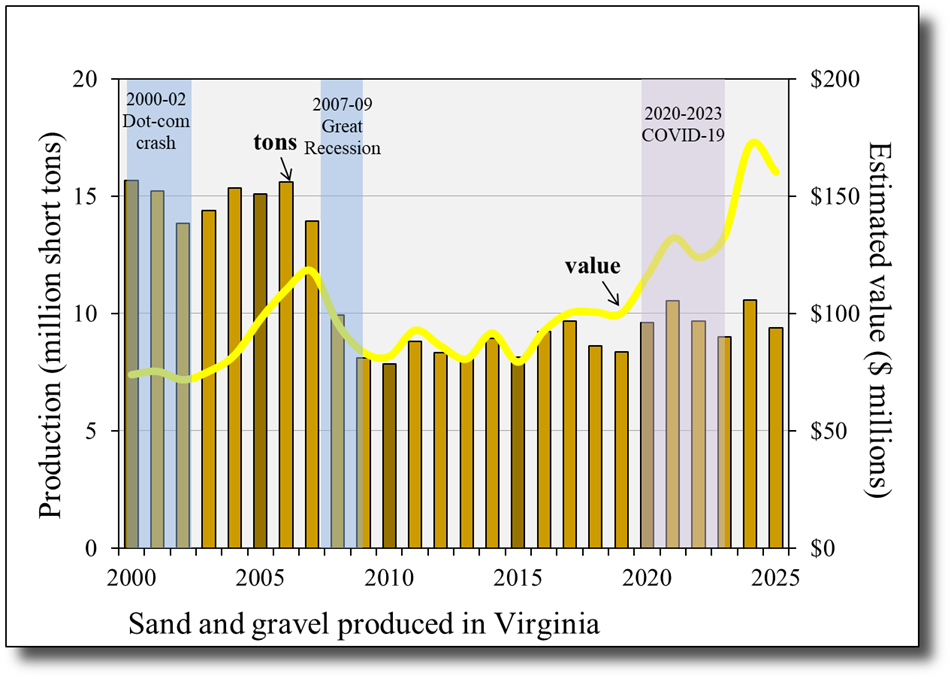
Annual production and estimated value 1
1 Estimates of annual mineral value are calculated using tonnages reported to Virginia Energy and commodity sales prices reported in numerous published and unpublished sources. The prices may include national or global industry averages. The calculated annual values do not necessarily reflect the actual sales prices received by mine operators in Virginia.
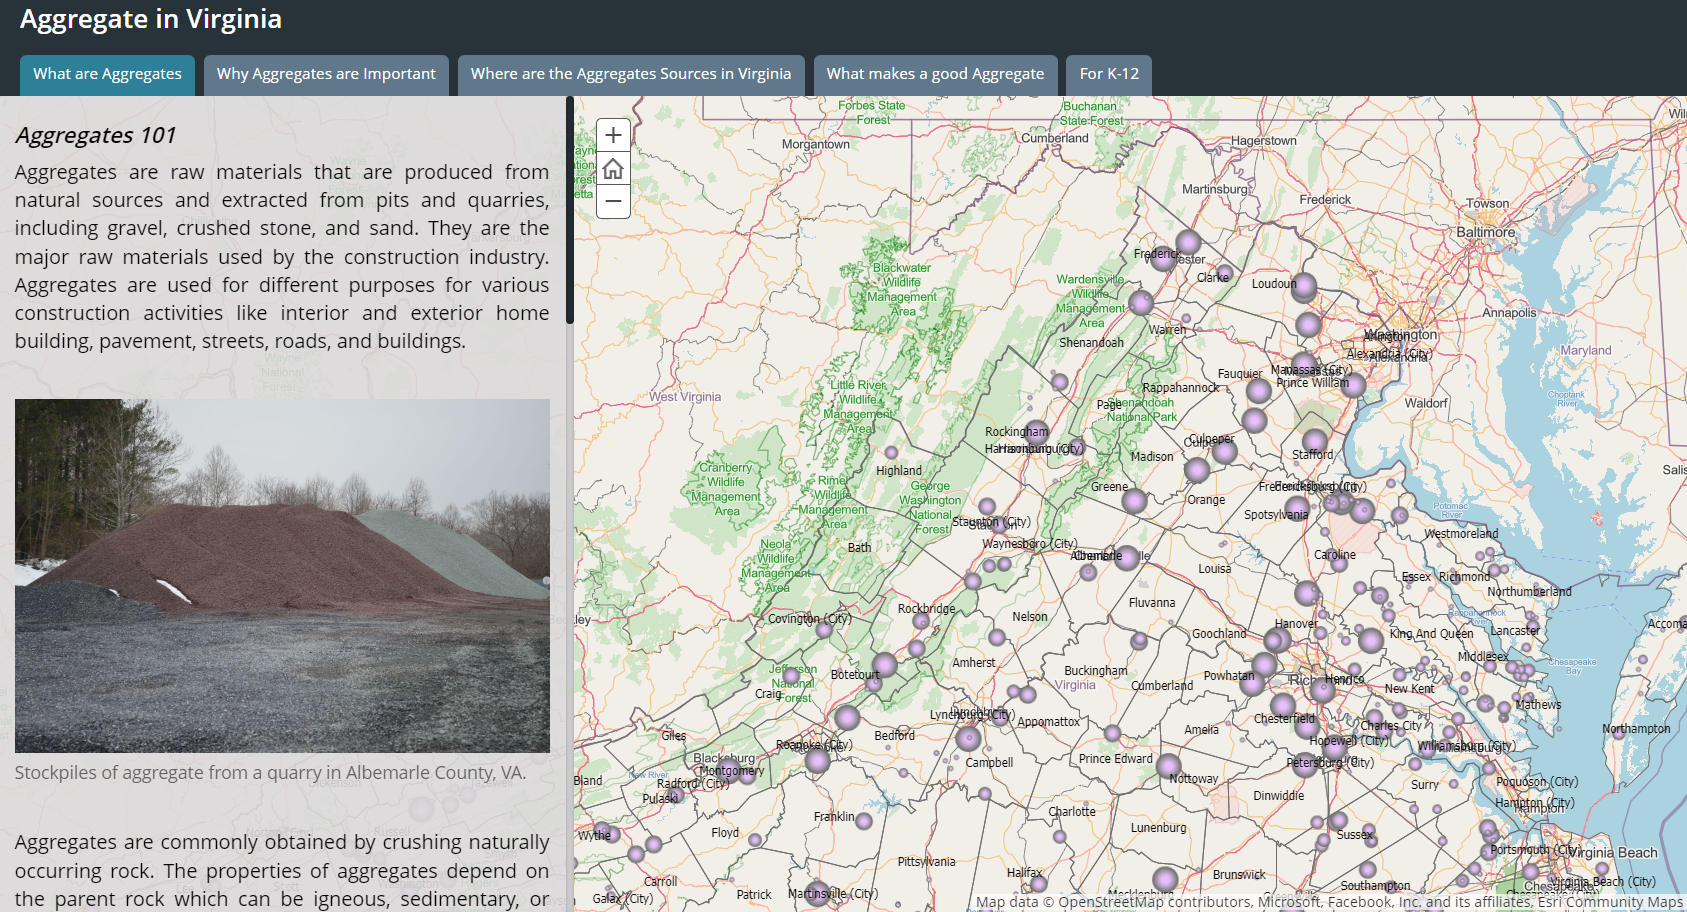
In 2022, Geology and Mineral Resources Program composed an interactive website: Aggregate in Virginia. This story map series include a description of aggregate and why they are important to us, the supply and demand status in each county, the location and production of aggregate mine sites, how geology can contribute to aggregate mining and land use planning, and the general geotechnical characteristics of aggregates in the state. This website also provides two activities for K-12 education. Click below to view the story map.
Selected References:
Virginia Department of Energy, 2020, Annual production reports submitted by mine operators, Division of Mineral Mining.
Gilmer, A. K., Enomoto, C. B., Lovett, J. A., and Spears, D. B., 2005, Mineral and fossil fuel production in Virginia (1999-2003): Virginia Division of Mineral Resources Open-File Report 05-04, 77 p.
National Stone, Sand & Gravel Association
Sweet, P. C., 1978, Sand and gravel resources in Virginia, in Contributions to Virginia geology: Virginia Division of Mineral Resources Publication 7, p. 67-74.
U.S. Geological Survey, 2026, Construction Sand and Gravel Statistics and Information
Virginia Division of Mineral Resources, 1993, Geologic Map of Virginia: Virginia Division of Mineral Resources, scale 1:500,000.
Wentworth, C. K., 1930, Sand and Gravel Resources of the Coastal Plain of Virginia: Virginia Division of Mineral Resources Bulletin 32, p. 1-146.
U.S. Geological Survey, 2020, Construction Sand and Gravel Statistics and Information